Developing a Higraph Editor

In the mid 1990s I was given a copy of David Harel’s paper “On Visual Formalisms“, where he described an extension to graph theory where nodes become sets – or ‘blobs’ 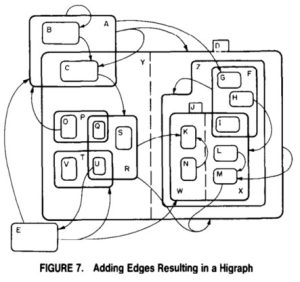 as he called them, and the edges were hyperedges – n-ary edges, rather than pure binary. The paper gives some examples, and some formal algebraic definitions.
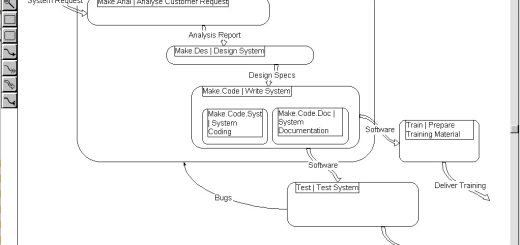
This had a huge impact on my thinking, and on modelling systems of various sorts. I developed an editor using Borland C++ and the OWL (Object Windows Library) for Windows 3.1 (95 was not yet out!). I managed to model the processes of a 17 000 person business on one (very intimidating!) A2 page.
Harel went on to work with the people defining UML, and higraphs underpin State Machines in UML to this day, and are the best known use-case. They can be applied more widely, but have never really ‘taken off’.
Recently, as I have been looking at the underpinnings of the processes in education, I have wanted a fully fledged higraph editor again. UML state machines are useful, and I found gaphor a powerful FOSS tool. Being written in Python, I hoped to extend it to support more generic higraphs, but its architecture is strongly UML aligned, and a bit above my ability as a Python programmer.
So I set out over the last few months to write something in Python that had a minimal set of development dependencies, a model based (rather than pure drawing) architecture, and would be able to support all the semantics – visual and algebraic – of higraphs.
I looked at TkInter, but not supporting anti-aliasing in 2025 was too much for me – I want the diagrams to look pretty. So I went with Qt, or, more precisely PySide6. Rich, a large community, pure Python. But a steep learning curve. So I set out some milestones:
- A basic node-edge editor – to learn the fundamentals of PySide/ Qt, and figure out the appropriate design patterns.
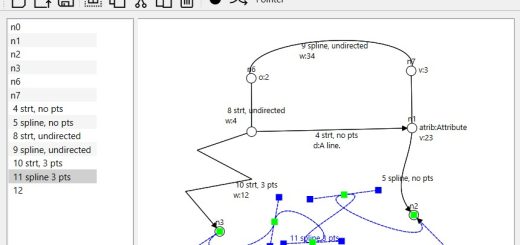
- Multipoint edges using Hermite Splines – because I find Bezier splines unintuitive!
- Add in hyperedges – the graphics for this is not straightforward.
- Figure out how to have multiple diagrams from one repository (UML modelling style).
- Extend nodes to blobs, or sets. I want to be able to support multiple parents, which is powerful, but adds quite a lot of complexity.
I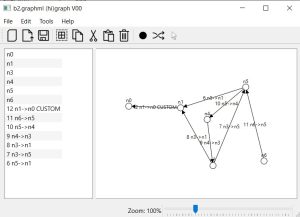 have now reached “minimum viable product” with step 1! This blog is partly to document the journey, and also to make a place to gather input on the design ideas.2000+ lines of Python, and I can edit graphs – and write Python code interactively against the live model (rudimentary, but it’s there!)
I am still figuring out git, and licences, and build systems, and weird garbage collection related bugs. I have a messy, private github repository, which I will try to tidy up and make it possible to get some interactions going.
I will try to post up the process as I go along, under the `higraph` tag on this site.