Higraphs for process models
Having achieve MVP with the Higraph tool, I now need – and get – to use it. Which is quite fun. Today, my Year 9 class were working hard on the post production of...
Posts relating to the semantics and development of a tool to graphically edit Higraphs.
Having achieve MVP with the Higraph tool, I now need – and get – to use it. Which is quite fun. Today, my Year 9 class were working hard on the post production of...
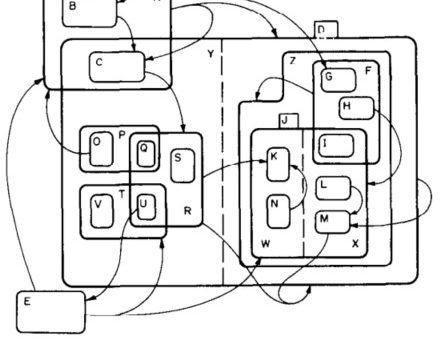
Version 0.3.0 went up, and then we removed some usability and cosmetic issues to get to V0.3.2.The image above shows the things it can do – sets can intersect, and contain other sets, or...
Version 020 was blobs. David Harel called nodes-as-sets “blobs”. They make graphs very expressive, particularly when you are trying to understand or model a complex topic. You can make high level general associations alongside...
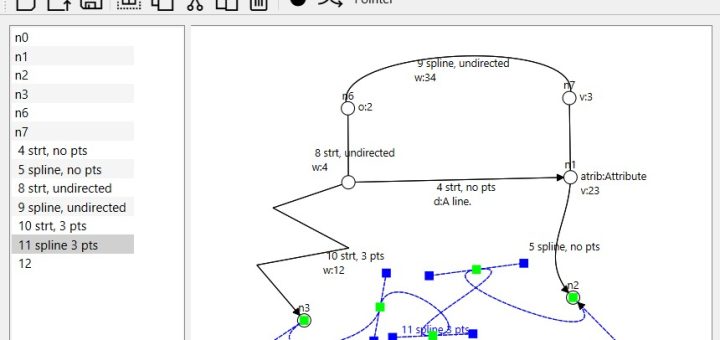
For the last few months, I have been working on adding decent edges to the editor. When I mentioned it to a very technical friend, he was a little surprised that I would put...
After about 150+ hours of wrestling with Qt, I have a “Minimum Viable Product” of a GUI graph editor. It can be found on github It surprises me that in 2025, the bulk of...
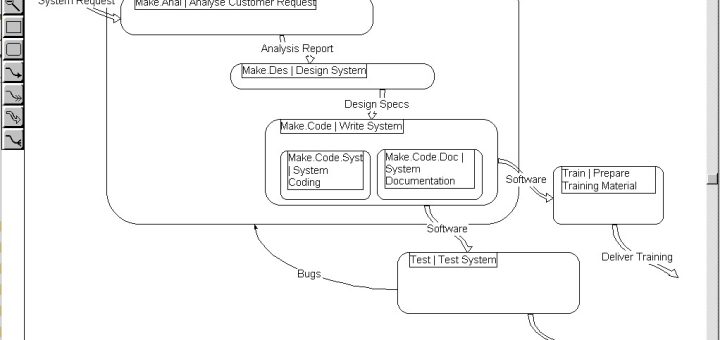
I was looking for an icon for the editor software, and I thought to look for the 1990’s tool – which had one. I had to fire up a Windows 98 VM to run...
In the mid 1990s I was given a copy of David Harel’s paper “On Visual Formalisms“, where he described an extension to graph theory where nodes become sets – or ‘blobs’ as he called them,...