qtPyGraphEdit V0.0.0-alpha is out.
After about 150+ hours of wrestling with Qt, I have a “Minimum Viable Product” of a GUI graph editor. It can be found on github
It surprises me that in 2025, the bulk of people working with graphs define and interact with them textually, and then get an algorithm to plot them. I understand the use-case. But surely there is a use-case for exploring the relationships between things visually, but equally formally? It seems not. There are some tools in the office automation space – Visio, the PowerPoints – that do it in a “dumb” way (many people don’t even use connectors!!!) But no tool to create and edit graphs of nodes and edges. On my way to writing a full higraph editor, I decided that a useful goal was a simple node-edge editor. It allowed me to understand how Qt works – and doesn’t work, and to get more familiar with the framework. Qt has over 2000 objects in the library, with at least 10 methods per object – it is huge. The interactions are critical and subtle. And the documentation is solid, but examples for my use-case were limited – I could find two really relevant gist-like fragments, which were invaluable – and I scrutinised them for hours, recreating and adapting, and at last beginning to understand how they worked. I think my use of chatGPT for this deserves its own post – it was valuable, and deeply frustrating in equal measure!
So, what’s in the box?
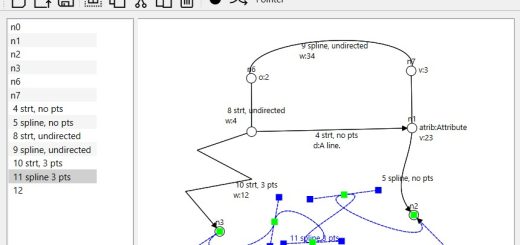
A canvas on which you can draw graphs, a list of the elements of the graph, and a toolbar. Choose the black blob, or push “N”, to create a node. Once you have 2 or more nodes, the wiggly lines or “E” will let you join nodes with edges. As you add an item graphically, it appears in the list at left. Move a node, and the edge follows. You can re-route nodes to other edges. You can change the name of items in the left pane. You can copy the image, and get a text dump of the model ala the algebraic view a graph-theorist might use:
nodeID:0,metadata:{'name': 'n2'},startsEdges:[4],endsEdges:[5]
nodeID:1,metadata:{'name': 'n1'},startsEdges:[5],endsEdges:[3]
nodeID:2,metadata:{'name': 'n0'},startsEdges:[3],endsEdges:[4]
edgeID:3,metadata:{'name': '5 n0->n1'},startNodes:[2],endNodes:[1]
edgeID:4,metadata:{'name': '4 n2->n0'},startNodes:[0],endNodes:[2]
edgeID:5,metadata:{'name': '3 n1->n2'},startNodes:[1],endNodes:[0]
You also get a bitmap image, and a graphml version.
It saves using the yEd file format. yEd is a very powerful Java-based graph editor, and they have some neat extensions to pure graphml for handling more sophisticated graphics. Currently, you can round trip models between the two tools, something I would like to keep up as far as possible.
You can export the image as an SVG, which works quite well. There is a print function, but the scaling there is broken, and needs some tinkering with.
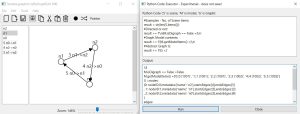
It also has an interactive Python scripting window, which has live access to the model. This is very rudimentary, but with some tweaking to the code, it could quite easily allow networkx style node and edge creation and analysis. I think being able to switch between a GUI and CLI in manipulating graphs could be very powerful.
There is a weird bug that I have fought with for hours, when you delete an edge, it sometimes disappears from the models, but remains painted for a while. I think it is related to parenting graphical objects in Qt, and how that interacts with Python’s garbage collection. It is possible to write the code so that Python hard crashes, without any error messages, but I think I have caught that one!
Next, I want to add Hermite spline edges for curves. Qt supports Bezier splines, but I find them counter-intuitive, and it should not be too difficult. (V01)
Then, to add hypergraph capabilities. n-ary edges, rather than purely binary. I find them very useful when modelling, to say “then this triggers that and that other thing”. The current abstract graph class handles this, but the graphics are a little more challenging. It will also require looking at the save format. (V02)
After that, I want to explore multiple graphical views of the same core set of elements. As graphs get complex, this can be a very good way to provide either an overview, or to focus on just one section. Again, this has file structure implications. (V03)
Then? I need to review the whole architecture. Qt doesn’t do a pure MVC model. I am not currently sure if I have the model appropriately separated – I think I might have a redundant layer. I will see as I go!
Once I have done that, I will take what works from this, and add higraph blobs – nodes will become sets. I want to allow multiple parenting for this, which will have its challenges, both in terms of the abstract maths, but also in terms of the implementation. Qt will support a hierarchical model pretty directly, but overlaps will get more complex. However, higraphs strength is precisely in accurately modelling complexity, so it should be worth it.
And once I have all of that, I will have the foundation of a tool to explore implementing some concepts in using Cognitive Load Theory in teaching, which is really my ultimate goal. The goal is important, because I want it to be useable by English teachers and people who have no idea that they are using “maths” to analyse their problems – they can just see the complexity of a given teaching topic laid bare, and a pathway to delivering it.