qtPyGraphEdit V0.1.0 – now with multipoint lines
For the last few months, I have been working on adding decent edges to the editor.
When I mentioned it to a very technical friend, he was a little surprised that I would put in the effort to write Hermite spline editing from scratch. For me, the ability to create a graph that represents what I see in my mind’s eye is important. Drawing graphs for me is not about a basic illustration of a simple case of something that will then be resolved using combinatorics or some other algebra. It is about a mind-model synthesis, where the model helps me to hold the whole in my head. Higraphs are particularly powerful for this, but experience from both my first version of the tool, and using state machine diagrams in a UML tool have underlined my need for a tool that helps me think.
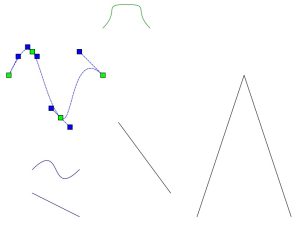
The output of the test run for the polyline code, with curved and rectilinear lines. One curve shows the selected state, with the handles for points and tangents.
So, for the last 3 or so months, I have plodded away. The problem: Qt doesn’t implement Hermite splines, only Bezier. I don’t find Bezier splines intuitive to edit (see above!). Yanking around a point somewhere off in space to change the flow of a line is … odd. Hermites give a far more direct feeling of manipulation. I am quite happy with how that turned out. The code for that is here. On a side note, the use of Codeberg is a deliberate strategy of creating some alternate communities. Having all the world’s source code under the control of one corporate entity has some security and continuity implications.
This code implements both rectilinear and curved multi-point lines. Their is a significant overlap in code between them, and I tried to implement a ‘Strategy Pattern‘. Not so easy. I’m not an OO purist, so some of my attributes are public. Running those through a strategy class was going to require a major rewrite. And having to deal with 20 methods for each class, essentially across 3 flavours of the classes… And the strategy pattern still meant that I had to maintain the code for both concrete strategies anyway. To quote my software engineer daughter on that: “If you need to do that, you need to question your life choices”. Combined with the fact that I already essentially have a parent ‘strategy’ container in the editor itself, I went for a simpler design.

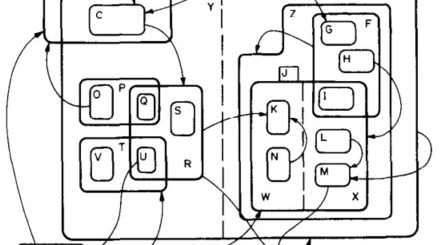
State chart for inserting a new edge between two nodes
Then to replace a simple point-to-point line in the editor with a multipoint line, which could either be rectilinear or curved. Ha! Getting the interaction with the element even vaguely intuitive gets complex quite quickly. The number of states and sub-states the mouse can be in for an graphical editing GUI gets scary. The state-chart to the left is from V00, on what happens when you insert a new edge.
Now, with multiple points, and some of those having tangent handles to manipulate, things get a little more interesting. Selecting only 1 edge is a different thing to selecting multiple elements.
And deselecting … I fear there are still some edge cases that I haven’t manage to iron out in V01, and ‘ghost’ handles sometimes remain behind. Reworking the mouse handling logic is on the radar screen, but I want to have all the graphical elements in place first, since what makes sense now may not be so sensible once nodes turn into sets. I am also still learning things about Qt and PySide (which are not identical, since one is in a language which has no garbage collection, and the other has automatic garbage collection. Here be dragons – gory details in an as yet unanswered forum post).
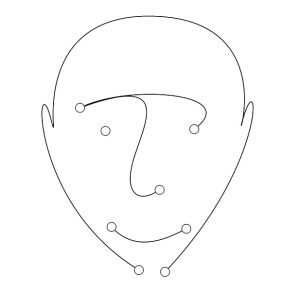
What’s the point of splines if you can’t make your graphs interesting?
That was the primary goal for this mini-release. But as I was testing, I got tired of having to change the code to swap between straight and spline, directed and undirected edges. So I got Copilot to sketch out the dialog to edit an edge, and then worked that up, and extended it to a node. But then one needs to save this information. I had been using a code from a project that reads and writes the graphML files from yEd, which served me well in V00. But now I was doing double work, extending that project, and rewriting my shim code. So I pulled in the XMLhandling. I am not sorry I did that – everything is a lot cleaner, and I can manage things better. Since my primary use case is saving and reading my own files, I don’t need to cater for as many edge cases as he had to, although I think I should to go back and make it a bit more fault tolerant.
This led me to the graphML spec itself, and the rather helpful primer they have. Reading that, and some related information has given me some useful insights as to how I will be able to rather elegantly store files with a universal graph model, which has multiple graphical views. In an aside, they mention that one graphML file can contain many graphs, and that will map very neatly on to how I see the “dictionary” of graph elements vs their multiple displays. That was a bit of a blind-spot in the future map, so I was glad to spot that.
But it also specifies how to deal with metadata rather clearly. And every metadata tag has to be defined. This is great, and allows typing and other good stuff, but I was now on a tertiary quest, and not keen to take up another. So I just added another xmlns entry, and made it work. That breaks some of the round-tripping of models to yEd, but that is going to happen sooner or later anyway. I have left handling metadata on the TODO list, and if there is any interest, I can spend some time to store metadata better.
So, after spending a good few hours each day for the last couple of weeks, I have V01 up on github. Nodes, splines, editing and displaying of metadata all pretty solidly working. The data is saved in a moderately standard format (graph structure still round-trips to yEd), and the SVG export works well. Printing has some random scaling issues that I shall need to explore once I have the rest of the pieces hooked in.
The next step is to implement the editing of hypergraphs, where edges move from 2-ended binary to multi-ended binary. I am not aware of any other general purpose graph editor that does this. yEd specifically don’t intend to. So this may start to be a genuinely useful tool.
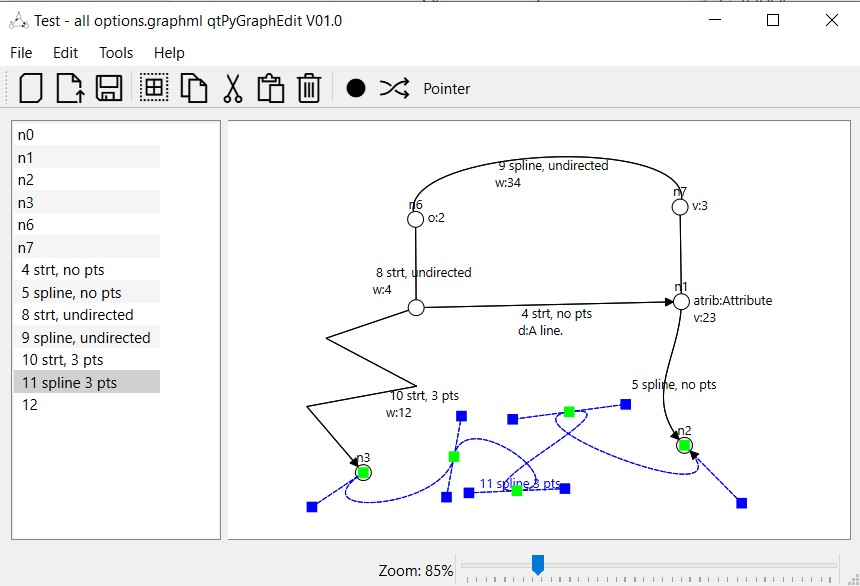
A screenshot showing all the features, and one spline edge selected for editing.
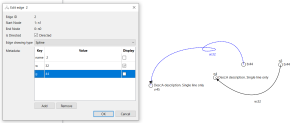
The edge editing dialog.