Beyond Minimum Viable Product …
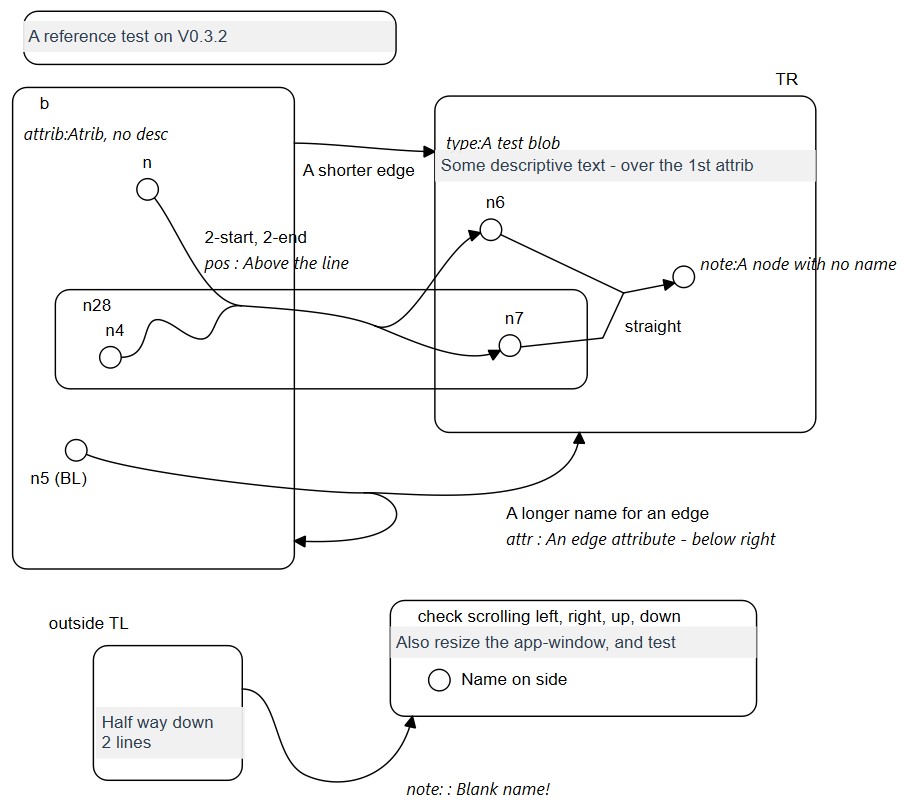
Version 0.3.0 went up, and then we removed some usability and cosmetic issues to get to V0.3.2.The image above shows the things it can do – sets can intersect, and contain other sets, or pure nodes – essentially elements of sets. Hyperedges are supported, as either curves (splines) or straight lines. Routing points can be added to edges, and the names of items can be (fairly freely) moved around.
I am rather pleased with the how edge name positions work. Computer graphics is all based on (x,y) coordinates, quite naturally. For nodes and blobs, text can be simply offset by an (x,y) value, and it will behave reasonably well when the blob is moved or resized. Edges are lines – essentially one dimensional, not two. So the position of text has to be handled differently. The ‘natural’ coordinate system of a line is length – how far along you are. This is normally referred to as t – I suspect from time, which is often used when studying motion. The position of text on a line is how far along, and a distance, d, how far away from, the line. And so the natural coordinates for the edge text are (t,d). This is implemented in V0.3.2.
Whilst there is a long list of features I’d like to add, from UI items to fundamental higraph concepts and some graph theory tools, my focus for now is on using the tool.
The impetus for this project was, and is, to be able to map out the complexities of the cognitive processes in education. My day job is teaching Computer Science at high school. Spending time reading in education articles, and the research behind them, I realised that all the thinking in the field is expressed textually, with occasional graphical illustrations. In later 2023, when I read John Sweller’s retrospective on Cognitive Load Theory, for the first time, I saw someone trying to create a “bigger picture”. But it was 20 pages of text. It took a lot of (cognitive!) effort to understand. As I wrestled with the ideas, I was reminded of the techniques for modelling complex systems, and Higraphs in particular. I sketched something in PowerPoint. But then updating it was painful (even using connectors!). So I looked for an appropriate tool, and found state diagrams in Gaphor. It is an excellent free UML tool, but UML state diagrams are not generic higraphs, and the specifics and complexities of a UML tool made it inappropriate. It is theoretically possible to add model types to Gaphor, but that would have meant writing features for Gaphor that were beyond my ability. Building its environment has a number of steps, including installing a C++ compiler! And then it involves some sophisticated programming patterns rather beyond me. Hence writing a tool – it was the same order of magnitude effort, and has given me the freedom to write the tool that I have in mind, for more generic, but hopefully no less rigorous modelling.
So hitting MVP has allowed me to head back to the purpose – building out models of educational processes and artefacts. I will most probably start a category here on educational posts now, since I suspect that will be the best way of documenting and sharing that journey.
Building the models surfaced various usability and default-value issues – hence the minor versions released. There are likely to be a few of these coming up, but not at the same cadence, since my energy is now moving more to “use” phase!
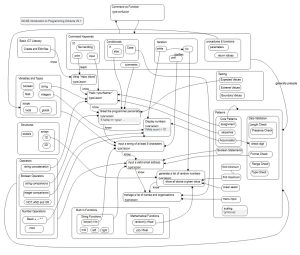
Because this is all about “visual formalisms”, it seems appropriate to share a rough model of the schema for teaching a beginners programming course. The first is the Gaphor model, created using a state diagram, the second is the nearly identical model, created in higraph. My colleagues tell me that the curved lines are much less intimidating, so it seems that the 3 months or so of effort in adding Hermite splines was worth it!
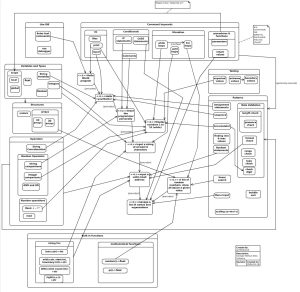
A higraph of the scheme for teaching beginners to program, drawn in Gaphor.
A higraph of the scheme for teaching beginners to program, drawn in Higraph.